

Shadow Diagrams
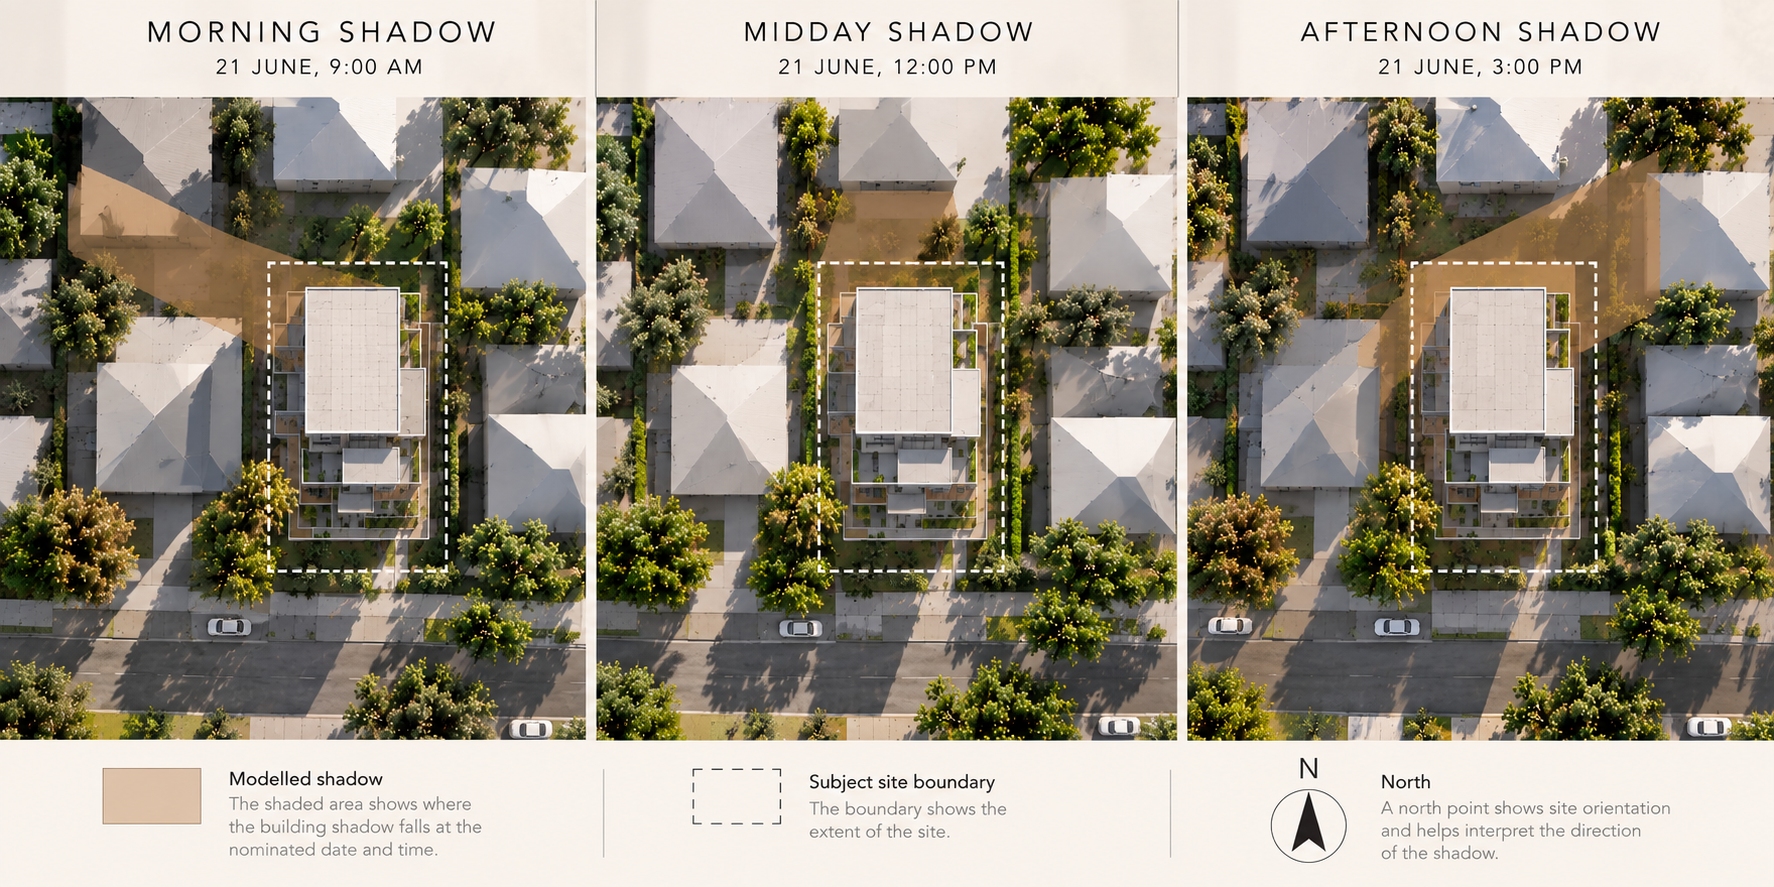
A shadow diagram represents the shadow condition at a particular moment. Because the position of the sun changes throughout the day, the direction and extent of the modelled shadow change as well. Showing several assessment times makes that movement visible rather than relying on a single snapshot.
In Brief
Shadow diagrams are shown at different times of day because each drawing represents only one moment. As the sun changes position, the modelled shadow changes direction and extent. A sequence of diagrams can therefore show how the shadow condition changes across the nominated assessment period. The exact times required depend on the project and the applicable assessment requirements.
Why are Shadow Diagrams shown at different times of day?
Shadow diagrams are prepared at different times because the shadow cast by a building does not remain in one position throughout the day. As the sun changes position in the sky, the direction and extent of the shadow also change.
A diagram prepared for one nominated time captures only that particular shadow condition. It cannot, by itself, show what happens earlier or later in the day.
By preparing a sequence of diagrams at different times, the drawings can show how the shadow moves across the site and surrounding context during the assessment period. This provides a more complete picture of the modelled shadow pattern than a single drawing alone.
The number and timing of those diagrams are not universal. They should reflect the assessment requirements that apply to the particular project.
What does a single Shadow Diagram represent?
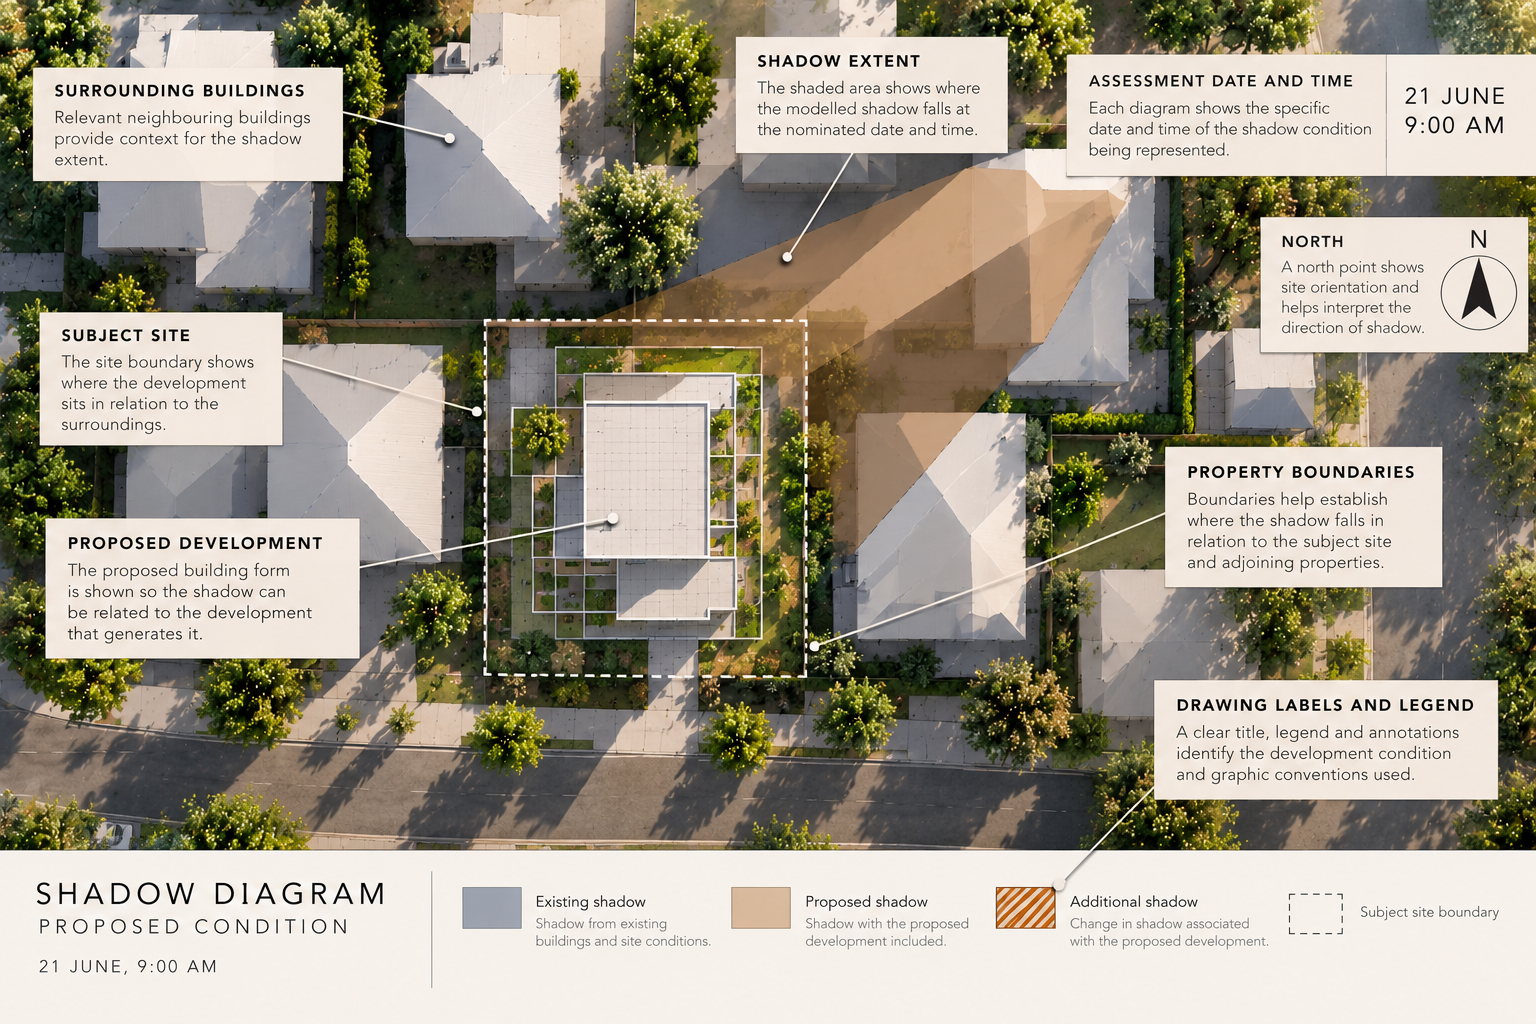
A single shadow diagram is a snapshot of a modelled shadow condition. It represents the relevant development geometry, site orientation and solar position for a nominated date and time.
For example, a diagram labelled 9:00 am represents the modelled shadow at 9:00 am under the date and project conditions identified on the drawing. It should not be read as showing the shadow condition for the entire morning.
The same applies to a midday or afternoon diagram. Each image records a different moment, allowing the reader to see where the shadow falls at that specific time.
When several of these snapshots are considered together, they begin to describe how the shadow condition changes across the nominated period.
A Shadow Diagram represents one moment in time. A sequence of diagrams shows how the modelled shadow changes as the sun moves across the sky.
Why does the shadow change during the day?
The apparent position of the sun changes across the sky during the day. The relationship between that solar position and the building geometry determines the direction and extent of the modelled shadow at a particular moment.
When the sun is lower in the sky, shadows can extend further from the objects casting them. As the solar position changes, the direction of the shadow changes as well.
This means that a building may cast shadow across one part of the surrounding area in the morning and a different area later in the day. A single diagram cannot communicate that progression.
Multiple assessment times allow those different shadow positions to be documented without requiring one drawing to represent an entire period at once.
Why are morning, midday and afternoon shadows different?
Morning, midday and afternoon diagrams capture the building under different solar positions. As a result, the shadow can differ substantially between each drawing even though the building itself has not changed.
A morning shadow may extend in one direction across the site or surrounding land. Around the middle of the day, the shadow position and extent change. Later in the afternoon, the shadow shifts again as the solar position continues to change.
Viewing these conditions together allows the reader to follow the changing shadow pattern rather than treating any one time as representative of the whole assessment period.
This is also why the time shown on each drawing is essential. Without knowing when the shadow was modelled, the position of the shaded area cannot be placed properly within the sequence.
Why are 9am, 12pm and 3pm often seen on Shadow Diagrams?
Times such as 9:00 am, 12:00 pm and 3:00 pm are commonly encountered in Australian shadow documentation because they provide separated reference points across the morning, middle of the day and afternoon.
When shown together, these times can provide a clear overview of how the modelled shadow changes across that part of the day. They can also make a drawing set relatively easy to compare because each diagram represents a distinct assessment moment.
They should not, however, be assumed to be the required times for every development. Some assessments may use different nominated times or more frequent intervals depending on the applicable planning requirements and the purpose of the assessment.
The same principle applies to the assessment date. While 21 June is commonly used as a winter reference condition in Australian shadow documentation, the appropriate date depends on the project. See Why Is 21 June Used for Shadow Diagrams in Australia? for a closer explanation of the date itself.
Do Shadow Diagrams always use the same assessment times?
No. The assessment times used for shadow diagrams can vary between projects.
The relevant planning controls, authority requirements, development type and purpose of the assessment can influence which times need to be represented. Some documentation may call for selected times, while other assessments may require diagrams at more frequent intervals across a nominated period.
This is why a familiar set of times from one project should not automatically be transferred to another. The appropriate assessment sequence should be established from the requirements relevant to the development being assessed.
Once those times have been established, the drawings can be prepared consistently so that the changing shadow condition can be compared across the required period.
Why should each Shadow Diagram clearly identify its time?
The assessment time tells the reader which moment in the sequence a drawing represents. Without a clear time label, two diagrams with different shadow positions can be difficult to place in context.
Clear labelling becomes especially important when a drawing set contains several times, existing and proposed conditions, or multiple graphical views. The reader should be able to identify the relevant condition without relying on the shadow shape alone.
The date, time, orientation, represented development condition and graphical conventions work together to establish what each diagram shows.
These drawing elements are considered in more detail in What Should a Shadow Diagram Show?
Why should existing and proposed shadows be compared at the same time?
When existing and proposed shadow conditions are being compared, equivalent assessment times allow the change associated with the development to be seen more clearly.
An existing 9:00 am condition can be compared with a proposed 9:00 am condition because both represent the site at the same nominated moment. The principal difference between them is then the development condition represented in the model.
Comparing an existing condition from one time directly with a proposed condition from another would introduce a second change: the solar position would also be different. That would make it harder to distinguish the effect of the proposed development from the normal change in shadow across the day.
For more on what that before-and-after comparison represents, see Existing vs Proposed Shadow Diagrams: What Is the Difference?
Does showing several times tell you whether solar access is adequate?
Not by itself. A sequence of shadow diagrams shows how the modelled shadow condition changes at the nominated times. It provides spatial information about where the shadow falls and how that position changes during the assessment period.
Determining whether solar access is adequate requires the relevant planning criteria to be considered. Depending on the project, those criteria may relate to particular areas, periods or other requirements that are separate from simply displaying the shadow.
This distinction is important because multiple diagrams can provide a detailed record of shadow movement without automatically establishing whether a development complies with a particular solar access control.
The shadow diagrams document the modelled conditions. The relevant solar access or planning assessment determines what those conditions mean for the project.
Different times within the wider shadow assessment
Date and time play different but connected roles in a shadow assessment. The assessment date establishes the relevant solar condition for that day, while the time identifies the particular moment being represented within it.
A single diagram provides one snapshot. A sequence of consistently prepared diagrams shows how the shadow changes from one nominated time to the next.
Together, those drawings can make the changing direction and extent of shadow easier to understand across the assessment period, particularly where the surrounding site context is also represented clearly.
The appropriate sequence is ultimately determined by the requirements of the project. The role of the diagrams is to represent those nominated conditions clearly and consistently.
Continue Reading
Understand the wider role of Shadow Diagrams
Different assessment times help show how shadow changes across the day. Explore how shadow diagrams are prepared, what they represent and how they support planning and development documentation.
Explore the Shadow Diagrams guide →Shadow Diagrams
Need Shadow Diagrams for your project?
A clear sequence of shadow diagrams can show how the modelled shadow changes across the nominated assessment times and how those conditions relate to the site and surrounding context.
Send us your current plans, survey and available planning information. We can review the project and help identify the appropriate shadow assessment pathway.
Start Your Project