


Design & Planning Intelligence
Project specific shadow diagram reports that illustrate where shadows from proposed developments fall at nominated dates and times, supporting planning assessment, council submission and design coordination.
Prepared for architects, building designers, planners and developers requiring clear graphical evidence of overshadowing and shadow extent. Where broader assessment of sunlight availability or neighbouring solar access is required, see our Solar Access & Overshadowing Analysis. Urbanfinity spatial data and modelling can be incorporated where appropriate.
Send Your Project DocumentsIn Brief
Shadow diagrams are visual studies that illustrate where shadows cast by existing or proposed buildings fall across a site and surrounding properties at nominated dates and times. They provide clear graphical evidence of shadow extent for planning assessment, development applications and architectural design coordination.
A shadow study may compare existing and proposed conditions to show how a new building, extension or altered built form changes the pattern of shade. The diagrams can identify additional shadow affecting neighbouring windows, private open space, balconies, gardens, communal areas and public spaces.
Shadow diagrams are commonly prepared at specific planning assessment times, including winter solstice dates where required by the relevant authority. They show the location and movement of cast shadows but do not, by themselves, provide a complete assessment of sunlight duration, internal daylight performance or solar exposure to an individual façade.
For development applications, planning assessment and design review where the extent of overshadowing must be documented at nominated dates and times.
Where shadows fall across buildings, neighbouring properties, windows and outdoor areas under defined seasonal and time-based conditions.
Shadow diagrams show where cast shadows fall. Sun Eye Diagrams instead examine whether the path of the sun is obstructed when viewed from a particular façade, window or outdoor location.
Knowledge Navigation
Use this guide to understand how shadow diagrams document cast shadows, support planning assessment and communicate the overshadowing effects of proposed built form at nominated dates and times.
Foundations
Understand how shadow diagrams illustrate where shadows cast by existing and proposed buildings fall across a site and surrounding properties.
Planning Need
Explore when shadow studies may be requested for development applications, planning assessment, design review or council information requests.
Assessment Context
See how shadow diagrams provide graphical evidence within broader assessments of sunlight access, neighbouring amenity and overshadowing.
Planning Support
Understand how clearly documented shadow conditions can support architects, planners, applicants, councils and development assessment teams.
Assessment Times
Explore why shadow direction and length vary by season, time of day, site latitude and the position of the sun.
Site Context
See how orientation, building height, massing, terrain and neighbouring development influence the location and extent of cast shadows.
Diagram Types
Review plan-based, three-dimensional, elevational and comparative formats used to communicate existing and proposed shadow conditions.
Assessment Boundaries
Understand why shadow diagrams do not replace detailed daylight modelling, thermal comfort analysis or façade-specific solar exposure assessment.
Related Knowledge
Planning Documentation
Shadow diagrams may be required when a proposed building, extension or development could cast additional shadow across neighbouring properties, private open space, windows, balconies, gardens, communal areas or public spaces. They are commonly submitted with development applications where the location and extent of overshadowing must be demonstrated clearly.
They are particularly relevant where building height, setbacks, orientation, roof form, site slope or proximity to adjoining development may alter existing shadow conditions. Existing and proposed diagrams can be compared to show the additional shadow attributable to the development at nominated assessment times.
The required dates, times, viewpoints and comparison format depend on the applicable planning controls, project location and assessment authority. Some applications require diagrams at defined winter solstice times, while others may request additional seasonal studies or more detailed evidence through a broader Solar Access & Overshadowing Analysis.
Shadow diagrams are often prepared where a consent authority needs clear graphical documentation of existing and proposed overshadowing conditions.
They can identify additional shadow affecting adjoining dwellings, windows, private open space, balconies, gardens and shared outdoor areas.
Early shadow studies can help design teams test building height, massing, setbacks and rooflines before key planning decisions become fixed.
Next in this guide: Understanding Solar Access and Overshadowing · Related: Sun Eye Diagrams
Assessment Context
Solar access describes the direct sunlight available to a building, window, private open space, balcony, courtyard, communal area or public space. Overshadowing occurs when surrounding built form or other site elements obstruct that sunlight at particular dates and times.
Shadow diagrams support this assessment by showing the geographical extent of cast shadows under defined conditions. Existing and proposed diagrams can be compared to distinguish current shadow patterns from the additional shadow created by a proposed building, extension or altered built form.
This graphical evidence can help identify locations that may require closer review, including neighbouring windows, private open spaces, balconies, gardens and communal areas. It can also assist design teams in understanding how building height, massing, setbacks and roof form influence the distribution of shadow across the surrounding context.
Shadow diagrams do not, by themselves, determine whether a proposal satisfies a particular sunlight duration, planning control or amenity criterion. Where interpretation against defined requirements is needed, the diagrams may form part of a broader Solar Access & Overshadowing Analysis.
Where existing and proposed shadows fall across neighbouring buildings, windows, outdoor areas and private open space at nominated assessment times.
How building height, setbacks, massing, roof forms, balconies and façade projections alter the extent and direction of cast shadow.
Which parts of the site or neighbouring properties may warrant more detailed review against relevant solar access or amenity requirements.
Whether early changes to building form or placement may reduce additional overshadowing before the planning design becomes fixed.
Next in this guide: Shadow Diagrams for Development Applications · Related assessment: Solar Access & Overshadowing Analysis
Planning Submission Support
Shadow diagrams are commonly prepared for development applications where a proposed building, extension or redevelopment may cast additional shadow across neighbouring properties, private open space, windows, balconies, communal areas or the public domain. They translate three-dimensional built form into clear planning documentation that can be reviewed by architects, planners, consent authorities and development assessment teams.
A development application package will often compare existing and proposed shadow conditions at nominated dates and times. This helps distinguish the shadows already present on and around the site from the additional shadow attributable to the proposed works.
Clear shadow documentation can also support design coordination before submission. It may reveal where building height, massing, setbacks, roof form or façade projections create avoidable overshadowing, allowing the design team to consider refinements before the planning response becomes fixed. Interpretation against specific sunlight or amenity criteria may require a broader Solar Access & Overshadowing Analysis.
Documents how shadows currently fall across the subject site and surrounding properties before the proposed works are introduced.
Shows the shadow pattern created by the proposed building, extension or altered built form under the same assessment conditions.
Diagrams are prepared for dates and times required by the relevant planning controls, project brief or assessment authority.
Helps identify the parts of neighbouring buildings, outdoor areas or public space affected specifically by the proposed development.
Next in this guide: Seasonal Shadow Conditions · Related assessment: Solar Access & Overshadowing Analysis · Related method: Sun Eye Diagrams
Planning Assessment
Councils request shadow diagrams because they provide a clear and consistent way to assess how a proposed development may affect surrounding properties and public spaces. Rather than relying on written descriptions alone, shadow diagrams illustrate where shadows fall at nominated dates and times, allowing planning officers to understand potential impacts on solar access and neighbouring amenity.
Many planning controls seek to protect reasonable access to sunlight for neighbouring dwellings, private open space, communal areas and the public domain. Shadow diagrams help demonstrate whether a proposal responds appropriately to these objectives and whether any overshadowing is consistent with the relevant planning framework.
The exact documentation requirements vary between councils and development pathways. Some projects require diagrams for specific dates and times, while others may require additional assessment where shadow impacts are more complex. Preparing the correct documentation early can help reduce requests for further information during the assessment process.
Assess whether neighbouring homes, open space, balconies and communal areas continue to receive reasonable access to sunlight.
Provide planners with objective visual information when reviewing building height, setbacks, massing and potential overshadowing.
Identify opportunities to refine the design before approval by reducing unnecessary overshadowing and improving the relationship between neighbouring buildings.
Continue reading: When Are Shadow Diagrams Required? · Related: Solar Access & Overshadowing Analysis
Assessment Timing
The position of the sun changes throughout the year. During winter the sun sits lower in the sky, creating longer shadows, while summer produces shorter shadows because of higher solar angles. The equinoxes represent intermediate seasonal conditions between these two extremes.
Shadow diagrams capture these changing conditions at nominated assessment dates and times. This allows project teams and consent authorities to compare how the same building casts different shadows as the seasonal position of the sun changes.
Many planning authorities specify particular dates and times for shadow studies so that different development proposals can be assessed using a consistent methodology. These diagrams document shadow extent only and do not independently assess solar performance or building comfort.
Lower solar angles generally create the longest cast shadows and are commonly used for planning assessment.
Intermediate shadow conditions that sit between winter and summer behaviour.
Higher solar angles generally produce shorter cast shadows, although the shadow direction continues to change throughout the day.
Next in this guide: Shadow Diagrams and Site Orientation · Related method: Sun Eye Diagrams
Site Context
Site orientation has a direct influence on the direction and extent of cast shadows. Buildings on north, south, east or west facing sites interact differently with the seasonal position of the sun, meaning identical building forms can produce very different shadow patterns.
Shadow diagrams make these differences visible by documenting how orientation, building height, setbacks, roof form and surrounding development influence shadow movement across the site and neighbouring properties at nominated assessment times.
This visual information assists planning documentation and design coordination by showing where additional shadow occurs. Where a project requires interpretation of sunlight duration or façade-specific solar exposure, shadow diagrams are often complemented by a broader Solar Access & Overshadowing Analysis.
Changing the orientation of a building alters the direction, length and location of cast shadows throughout the day and across different seasons.
Shadow diagrams document how surrounding buildings, site slope, vegetation and other physical features influence the distribution of cast shadows across adjoining properties.
Next in this guide: Residential and Commercial Applications · Related method: Sun Eye Diagrams · Related assessment: Solar Access & Overshadowing Analysis
Project Applications
Shadow diagrams are prepared across a wide range of residential, commercial and mixed use developments wherever the extent of cast shadow must be documented. They are commonly included with planning submissions for new buildings, alterations, additions, dual occupancies, townhouses, apartment developments, commercial projects and larger urban proposals.
For residential developments, the diagrams typically document existing and proposed shadow affecting adjoining dwellings, private open space, balconies, courtyards, gardens and neighbouring windows. They provide clear visual evidence of how the proposed built form changes surrounding shadow conditions.
Commercial and mixed use projects frequently require shadow diagrams to document impacts on adjoining buildings, public spaces, streets, podiums, communal open areas and neighbouring development. These diagrams help communicate the physical extent of cast shadow during planning assessment.
Where planning controls require interpretation of sunlight duration, overshadowing criteria or neighbouring amenity outcomes, the shadow diagrams are often supported by a broader Solar Access & Overshadowing Analysis.
New homes, alterations, additions, dual occupancies, townhouses and apartment developments commonly require shadow diagrams to document existing and proposed shadow conditions.
Commercial developments often use shadow diagrams to document cast shadow affecting adjoining sites, streets, public areas and surrounding built form.
Larger urban projects commonly compare existing and proposed shadow conditions across multiple buildings, streets, communal open spaces and the wider site context.
Next in this guide: Common Types of Shadow Diagrams · Related method: Sun Eye Diagrams · Related assessment: Solar Access & Overshadowing Analysis
Diagram Types
Shadow diagrams can be presented in several formats depending on the planning pathway, project complexity and the level of visual communication required. While the presentation may differ, each format documents the extent and location of cast shadows under the same assessment conditions.
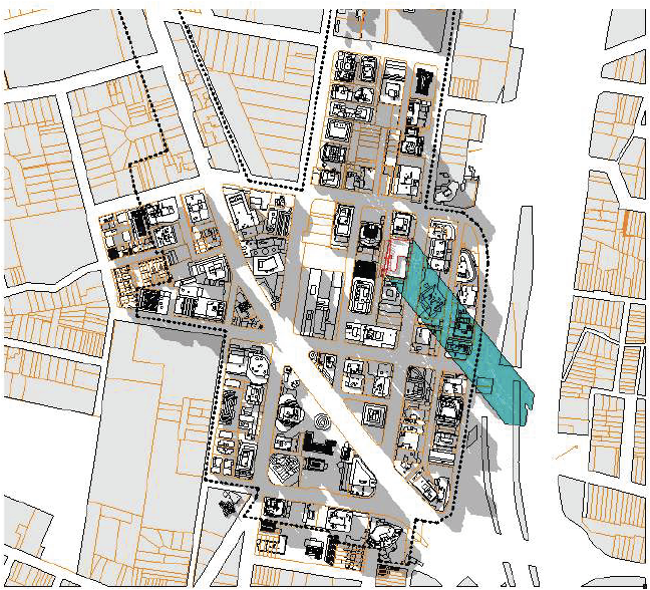
Bird's eye diagrams provide a plan view of the site, making it easy to compare how cast shadows extend across neighbouring properties, streets, open space, building footprints and the surrounding context.
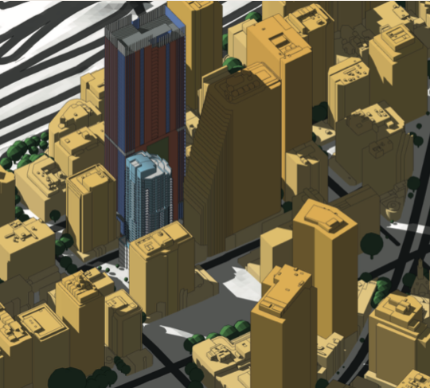
Three dimensional shadow diagrams provide additional spatial context by illustrating how proposed built form generates cast shadows across the surrounding environment from a realistic viewing perspective.
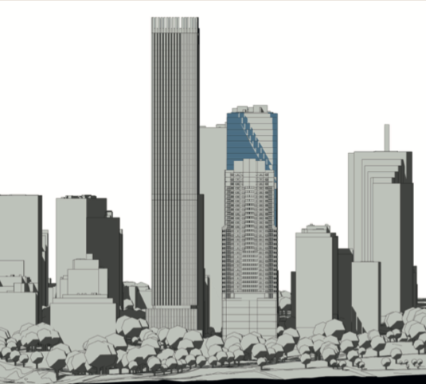
Elevation shadow diagrams illustrate the projected shadow profile of a building on vertical planes and neighbouring structures, helping communicate shadow extent from an elevation viewpoint.
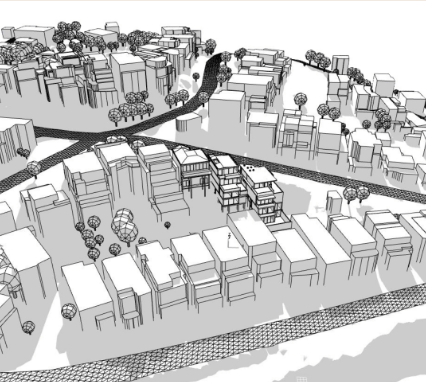
Site based studies document the extent of cast shadows across neighbouring land, private open space, communal areas, streets and locations where planning controls require overshadowing to be demonstrated.
Different diagram formats communicate different aspects of the same shadow information. Planning submissions commonly rely on plan based comparisons of existing and proposed conditions, while three dimensional views help explain the spatial extent of cast shadow to architects, consent authorities, project teams and other stakeholders.
Next in this guide: What Is Included in a Shadow Diagram Package? · Related: Development Applications · Sun Eye Diagrams
Shadow Study Documentation
A professional shadow diagram package provides clear graphical documentation of existing and proposed cast shadows, supporting planning submissions, design coordination and development assessment.
The content of a shadow diagram package varies according to the project type, available architectural information, surrounding context and planning requirements. Some projects require only a straightforward comparison of existing and proposed conditions, while others need more comprehensive documentation covering adjoining properties, public spaces or multiple assessment locations.
A well prepared package allows project teams, consent authorities and other stakeholders to understand where cast shadows occur, when they occur and how proposed development changes existing shadow conditions. Where interpretation against planning criteria is required, the diagrams may also support a broader Solar Access & Overshadowing Analysis.
Document the existing shadow conditions across the subject site and surrounding properties before any proposed development is introduced.
Illustrate the cast shadows generated by the proposed building, extension or altered built form under the nominated assessment conditions.
Prepared for the dates and times specified by the planning authority, project brief or applicable assessment requirements.
Includes sufficient surrounding context to communicate how cast shadows extend across adjoining buildings, land, streets and open space.
Side by side comparisons clearly distinguish existing shadow conditions from the additional shadow created by the proposed development.
May include drawing references, modelling assumptions, assessment dates, orientation information and explanatory notes supporting the submitted diagrams.
The quality of a shadow study depends on the quality of the available project information. Accurate architectural drawings, survey information, site levels and neighbouring context enable more reliable shadow modelling and clearer planning documentation.
Next in this guide: Urban Form, Setbacks and Neighbour Relationships · Related: Common Types of Shadow Diagrams
Understanding the Difference
Shadow Diagrams and Sun Eye Diagrams both assess the relationship between buildings and the sun, but they answer different questions. Although they are often requested for the same project, they are not interchangeable and are used for different stages of planning and design.
A Shadow Diagram shows where shadows fall across a site or neighbouring properties at selected dates and times. It is primarily used to assess overshadowing, solar access and planning impacts for development applications.
A Sun Eye Diagram looks from a single point outward, mapping the visible sky, surrounding obstructions and the annual path of the sun. Rather than showing where shadows fall, it explains why sunlight reaches or does not reach a particular window, façade or outdoor location throughout the year.
Best suited for understanding the impact of a proposed building on neighbouring properties and outdoor spaces.
Best suited for understanding solar access from a specific point on the site, such as a window, courtyard or façade.
If your project needs to demonstrate how a proposed development affects neighbouring properties, a Shadow Diagram is usually the appropriate assessment. If you need to understand solar access to a specific window, courtyard, façade or outdoor space throughout the year, a Sun Eye Diagram may be more appropriate. Many projects benefit from using both assessments together because they answer complementary questions about solar behaviour.
Related: Complete Guide to Sun Eye Diagrams · Continue reading: Common Types of Shadow Diagrams
Shadow Study Process
Shadow diagrams are created by combining architectural information, surveyed site context and digital three dimensional modelling to calculate and document cast shadows at nominated assessment dates and times.
Preparation begins by reviewing the proposed development together with the surrounding site context and the applicable planning requirements. Architectural drawings, survey information, neighbouring buildings, site levels, roof forms and building heights are assembled to create an accurate digital model of the project.
The model is then used to calculate cast shadows at the nominated assessment dates and times required for the project. The resulting diagrams are presented in a consistent format so architects, consent authorities, planners and other stakeholders can clearly compare existing and proposed shadow conditions.
Architectural plans, elevations, roof forms, site levels and building heights are converted into an accurate digital model.
Neighbouring buildings, site boundaries, terrain and surrounding context are added where required to accurately represent existing conditions.
The software calculates cast shadows for the nominated dates and times specified by the planning authority or project brief.
The completed diagrams are organised into a planning-ready report showing existing conditions, proposed conditions and supporting documentation where required.
The level of modelling detail depends on the scope of the project and the planning pathway. Some developments require straightforward plan-based documentation, while larger projects may include three dimensional visualisations, comparison views and more extensive surrounding context.
Where broader spatial modelling is beneficial, Certified Energy can incorporate Urbanfinity Consulting's mapping and three dimensional context modelling to improve the clarity of planning documentation and stakeholder communication.
Next in this guide: Urban Form, Setbacks and Neighbour Relationships · Related: What Is Included in a Shadow Diagram Package?
Urban Context
Changes in building height alter the length and extent of cast shadows, particularly during lower winter sun angles.
Building setbacks influence where cast shadows begin and how far they extend across neighbouring land.
Shadow diagrams document how proposed development relates to adjoining buildings, streets, open space and surrounding structures.
Urban form has a direct influence on the distribution of cast shadows. Building height, setbacks, roof geometry, separation distances and surrounding development all affect where shadows fall and how they change throughout the day and across different seasons.
Shadow diagrams document these physical relationships by comparing existing and proposed conditions. This provides a consistent visual record of how changes in built form alter shadow extent across the subject site and neighbouring properties.
The diagrams themselves do not determine whether a proposal satisfies planning controls or solar access criteria. They provide the graphical information used by project teams and consent authorities when reviewing development proposals.
Where a project requires interpretation of shadow duration, planning compliance or neighbouring solar access, shadow diagrams are commonly supported by a dedicated Solar Access & Overshadowing Analysis.
Next in this guide: Façade Shading and Passive Environmental Response · Related: Solar Access & Overshadowing Analysis · Sun Eye Diagrams
Understanding the Results
Shadow diagrams document the location and extent of cast shadows at specific dates and times. They provide a visual representation of shadow conditions but do not, on their own, determine whether a proposal satisfies planning controls or environmental performance requirements.
For many projects, the diagrams form part of a wider planning assessment. Consent authorities, architects and planning consultants may use the diagrams together with planning controls, development standards and supporting technical reports when reviewing a proposal.
Where interpretation of sunlight duration, planning compliance or neighbouring solar access is required, shadow diagrams are commonly accompanied by a dedicated Solar Access & Overshadowing Analysis.
Where cast shadows occur at nominated assessment dates and times.
Existing and proposed shadow conditions for planning documentation.
Planning compliance, daylight performance or thermal comfort.
Broader planning and environmental assessments where additional interpretation is required.
Next in this guide: Relationship to Daylight Modelling and Thermal Comfort · Related: Solar Access & Overshadowing Analysis
Related Building Performance Studies
Shadow diagrams document where cast shadows occur at nominated dates and times, making them an important planning and visual communication tool. However, they do not measure daylight availability, thermal performance or occupant comfort within a building.
Where a project requires detailed assessment of natural light, internal environmental conditions or compliance with building performance objectives, additional modelling may be required alongside the shadow diagrams.
Rather than replacing one another, these assessments answer different questions. Shadow diagrams provide the graphical record of cast shadows, while other specialised studies evaluate how those conditions influence building performance.
Document the location and extent of cast shadows at nominated assessment dates and times.
Evaluates the quantity and distribution of natural daylight within internal spaces.
Assesses indoor thermal conditions and predicted occupant comfort using environmental simulation.
Next in this guide: Cost and Time Considerations · Related: Daylight Modelling · Thermal Comfort Modelling · Solar Access & Overshadowing Analysis
Project Scope
The scope of a shadow diagram study depends on the scale of the proposed development, the level of surrounding context that must be modelled and the planning requirements that apply to the project. Smaller residential developments often require straightforward documentation, while larger commercial or mixed use projects may involve more extensive modelling and multiple assessment views.
The quality of the available project information also influences the preparation process. Architectural drawings, survey information, site levels, neighbouring buildings and any specified assessment dates all contribute to the completeness of the final shadow diagram package.
Where shadow diagrams are being prepared for a development application or council request, confirming the required assessment dates, diagram format and submission requirements at the outset helps ensure the documentation aligns with the relevant planning pathway.
Different project types require different levels of modelling, surrounding context and planning documentation.
Architectural drawings, surveys and accurate surrounding context improve the quality of the finished diagrams.
Planning authorities may specify assessment dates, required views or comparison diagrams that determine the final scope.
Providing complete project information early helps streamline preparation and minimise unnecessary revisions.
Most shadow diagram studies begin with the project address, architectural drawings, survey information where available, the applicable planning pathway and any council or consultant requirements for assessment dates, diagram formats or submission deadlines.
Next in this guide: Architectural Design Team Coordination · Related: What Is Included in a Shadow Diagram Package?
Assessment Process
Most shadow studies follow a straightforward process, from reviewing project drawings through to preparing planning-ready documentation.
Architectural drawings, site surveys and planning requirements are reviewed to establish the scope of the assessment.
The proposed building and surrounding context are modelled so sunlight and shadow can be accurately simulated.
Shadow diagrams are produced for the nominated dates and times to assess solar access and overshadowing impacts.
The completed diagrams help architects, planners and assessment authorities understand the project's solar impacts.
Project Information
Accurate project information allows shadow diagrams to be modelled consistently and prepared in accordance with planning and assessment requirements.
Most shadow studies begin with architectural drawings and a current site survey. Together these documents define the proposed building geometry, site boundaries, existing ground levels and the surrounding context required for accurate digital modelling.
Project information is commonly supplied as PDF or DWG files, although other formats may also be suitable depending on the scope of the study. Where planning authorities specify particular assessment dates, times or presentation requirements, these should also be provided at the beginning of the project.
Providing complete information from the outset reduces unnecessary revisions and helps ensure the finished shadow diagrams align with the intended planning pathway.
Defines site boundaries, levels, existing buildings and surrounding features used within the digital model.
Plans, elevations, roof plans and sections establish the geometry of the proposed development.
Adjacent buildings, streets, open space and surrounding land may be required where they influence the extent of cast shadows.
Planning requirements identify the assessment dates, presentation format and comparison views expected for the project.
Design Development
Shadow diagrams provide more value when they are prepared early in the design process rather than only at the point of development application. Early visualisation allows project teams to understand how changes to building form influence cast shadows before key design decisions become fixed.
As a concept evolves, shadow studies can be repeated to compare alternative building envelopes, setbacks, roof forms and upper-level articulation. This iterative approach helps identify opportunities to reduce overshadowing while maintaining the broader design intent.
Because the diagrams communicate shadow behaviour visually, they are often useful during discussions between architects, planners, landscape architects, clients and consent authorities. They provide a common reference point for understanding how a proposal interacts with its surrounding environment.
Testing alternative building envelopes before detailed documentation begins.
Reviewing setbacks, building height and upper-level massing to reduce overshadowing.
Comparing existing and proposed conditions before preparing planning documentation.
Communicating shadow impacts clearly to project stakeholders throughout the design process.
Next in this guide: Future Environmental Building Response · Related: Urban Form and Neighbour Relationships · How Shadow Diagrams Are Created
Assessment Dates
Shadow diagrams are typically prepared for specific dates and times that represent important seasonal solar conditions. These assessment dates allow planners, architects and assessment authorities to consistently compare the impact of proposed development on neighbouring solar access and overshadowing.
In Australia, winter assessments are often the most significant because the sun is lower in the sky and shadows extend further across neighbouring properties. Depending on the planning pathway, additional studies may also be prepared for summer or equinox conditions where seasonal solar behaviour is relevant to the project.
The required assessment dates vary between councils, planning authorities and project types. Always confirm the applicable requirements before preparing a development application or planning submission.
Often the primary assessment period because lower sun angles create the longest shadows and provide the clearest understanding of potential overshadowing impacts.
Some projects include equinox studies to demonstrate solar behaviour during spring or autumn, providing an intermediate seasonal reference.
Summer studies may be prepared where projects need to demonstrate façade shading, outdoor comfort or broader seasonal solar performance.
There is no single assessment date that applies to every project in Australia. Councils and planning frameworks may specify different dates, times or reporting formats depending on the development type and local planning controls. Confirming these requirements early helps avoid delays during the assessment process.
Continue reading: Seasonal Sun Behaviour · Related: Sun Eye Diagrams
Understanding the Limits
Shadow diagrams are an effective way to visualise where shadows fall at selected dates and times, but they do not answer every question about a building's environmental performance. They provide a snapshot of shadow movement rather than a complete assessment of sunlight, daylight or occupant comfort.
For many projects, shadow diagrams form the first step in understanding solar behaviour. Where more detailed analysis is required, additional assessments may be used to evaluate daylight availability, thermal comfort, façade performance or annual solar access.
Knowing the limitations of each assessment helps project teams select the right combination of tools rather than expecting one report to answer every design question.
If you need to understand where shadows fall, shadow diagrams are usually the appropriate assessment. If your project needs to understand how much daylight enters a space, consider Daylight Modelling. If the focus is annual solar access to a particular location, a Sun Eye Diagram may be more suitable. Where occupant comfort is the priority, Thermal Comfort Modelling provides a more comprehensive assessment.
Related: Daylight Modelling · Sun Eye Diagrams · Thermal Comfort Modelling
Good Practice
The usefulness of a shadow diagram depends not only on the software used but also on the quality of the underlying information. Incomplete site data, incorrect building geometry or missing surrounding context can all affect how accurately the diagrams represent cast shadows.
Planning authorities may also require specific assessment dates, times or presentation formats. Preparing diagrams that do not match these requirements can result in additional requests for information or unnecessary revisions during the assessment process.
Reviewing project information before modelling begins helps ensure the finished diagrams clearly communicate the shadow impacts that are relevant to the proposal.
Missing surveys or surrounding buildings can reduce modelling accuracy.
Shadow studies should reflect the dates and times specified by the relevant planning pathway.
Neighbouring buildings and open space often need to be included to communicate shadow impacts properly.
Existing and proposed conditions should be easy to compare within the final documentation.
Well-prepared shadow diagrams provide a clear visual record of cast shadows, helping architects, planners and consent authorities understand how a proposal responds to its surrounding environment and whether additional assessment may be required.
Next in this guide: Shadow Diagrams FAQ · Related: Shadow Diagram Documentation
Frequently Asked Questions
Shadow diagrams show how shadows fall from existing or proposed buildings at nominated dates and times. They are commonly used to assess overshadowing, solar access and the relationship between a proposed development and neighbouring properties, private open space or the public domain.
Many development applications require shadow diagrams where a proposal could affect neighbouring solar access or overshadow surrounding land. The exact requirements depend on the planning authority, project type and applicable planning controls.
No. Requirements vary between councils and planning authorities. Some specify particular assessment dates, presentation standards or overshadowing criteria, while others only request shadow diagrams for developments where solar access is likely to be affected.
Shadow diagrams provide the visual record of cast shadows. Solar access analysis goes further by assessing how those shadows affect access to sunlight for buildings, open space and neighbouring properties. Shadow diagrams often form one component of a broader solar access assessment.
The terms are often used interchangeably, although a shadow study usually refers to the complete assessment package. Shadow diagrams are the visual drawings, while a shadow study may also include comparisons, supporting notes and planning documentation.
Shadow diagrams show where cast shadows fall across a site at selected times. Sun Eye Diagrams assess the visible path of the sun from a specific location and identify surrounding obstructions. Although related, the two studies answer different planning and design questions.
Yes. Shadow diagrams can be prepared for different dates throughout the year. Winter studies are commonly requested because lower sun angles create longer shadows, although summer and equinox studies may also be required depending on the planning pathway.
Most projects require architectural drawings, a current site survey, project address and any planning requirements that specify assessment dates or presentation standards. Additional surrounding context may also be required for more complex developments.
Shadow diagrams are typically prepared by professionals experienced in architectural modelling, planning documentation or environmental analysis. They are commonly produced to support development applications, design review and planning assessments.
Yes. Preparing shadow diagrams during concept design allows architects to compare building envelopes, setbacks, roof forms and site layouts before planning documentation is finalised. This can reduce overshadowing and improve how a proposal responds to its surrounding context.
No. Shadow diagrams are prepared for residential, commercial, mixed use, education, health care and urban development projects. They are particularly valuable wherever building height, density or proximity to neighbouring land may influence overshadowing or solar access.
Related Knowledge
Shadow diagrams document where cast shadows fall. Related studies answer different questions about sunlight availability, sun-path obstruction, internal daylight and thermal conditions.
Understand how shadow evidence is interpreted against sunlight duration, neighbouring amenity and applicable planning criteria.
Examine the visible sun path from a nominated location and identify the buildings, terrain or vegetation that obstruct direct sunlight.
Assess the quantity and distribution of natural daylight within rooms, workspaces and other internal environments.
Evaluate predicted indoor thermal conditions and occupant comfort where environmental simulation is required.
Review the existing, proposed and comparative drawings commonly included within a professional shadow diagram package.
Understand what shadow diagrams document, what they do not assess and when additional technical analysis may be required.
Each of these studies has a distinct role. Shadow diagrams provide graphical evidence of cast shadow, solar access analysis interprets sunlight impacts against defined criteria, Sun Eye Diagrams examine obstruction from a nominated viewpoint and building performance modelling evaluates internal daylight or thermal conditions. Keeping these purposes separate helps project teams select the right assessment for the question being considered.
Final step: Discuss a Shadow Diagram Project · Return to: Knowledge Navigation
Project Review
Send the available architectural drawings, survey information and relevant planning requirements for an initial project review. Certified Energy can help identify whether the project requires standalone shadow diagrams, more detailed overshadowing documentation or a broader Solar Access & Overshadowing Analysis.
Reviewing the scope early can help confirm the required assessment dates, surrounding context, comparison views and planning documentation before the design or submission package becomes fixed.
Last reviewed: June 2026. This page is maintained by Certified Energy as part of its Shadow Diagrams Knowledge Hub.
